
Buy at the lowest price without lifting a finger. Bubeph continuously monitors Amazon prices, tracks every price fluctuation, and sends price drop alerts the moment a better deal becomes available. Stay informed with real-time price notifications and shop confidently knowing you're getting the best value—without constantly checking Amazon yourself.
Track Prices Automatically
Add any Amazon product to Bubeph, and we'll start price monitoring immediately. Every price change is recorded, giving you access to complete historical price data without manually refreshing product pages.
You can:
- Track multiple products from one dashboard
- Monitor real-time price tracking
- Build a personal product price watch
- Receive automatic price notifications
- Follow every price fluctuation
View Complete Price History
See exactly how a product's price has changed over time with interactive price history charts. Bubeph helps you analyze price trends, identify recurring discounts, and determine whether the current price is actually a good deal.
Instead of guessing, you'll make buying decisions based on real pricing data.
Analyze Price Trends Before Buying
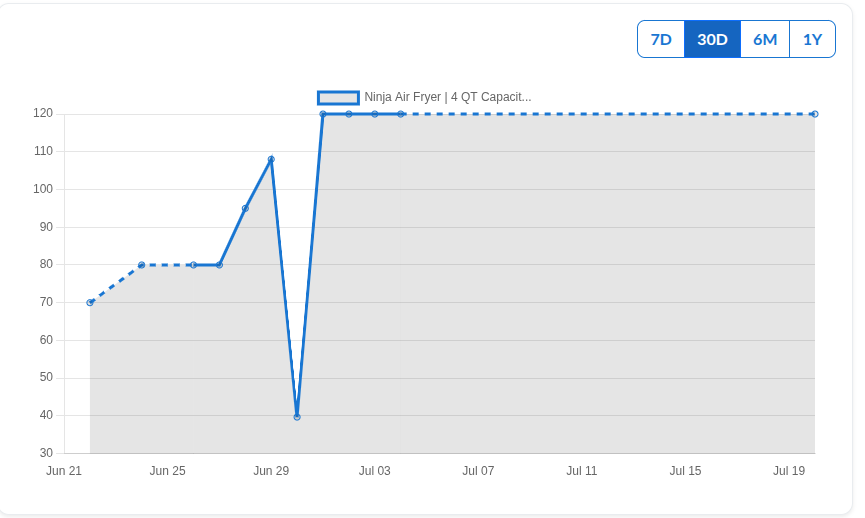
This is an example of extreme retail price volatility tracked through price tracker technology. The Ninja Air Fryer shows significant fluctuations over 30 days, starting at $70 and climbing to $120 by late June.
The most notable event occurred on July 2 with a flash sale dip to $40—a critical opportunity for deal monitoring that quickly reversed. This dramatic swing between $40 and $120 demonstrates why price comparison tools and best buy timing alerts matter for savvy shoppers. After stabilizing at $120 from early July onward, the product maintained premium pricing, suggesting strong demand.
Using Bubeph's price dip alerts and stock monitoring features would help capture similar correction opportunities for future purchases.
Price Movement Breakdown
| Phase | Dates | Price Range | Status |
|---|---|---|---|
| Entry Phase | Jun 21-28 | $70 → $110 | Gradual rise (+57%) |
| Peak Phase | Jun 29-30 | $118-120 | Highest price point |
| Crash Phase | Jul 02 | $40 | Flash drop (-67%) |
| Recovery Phase | Jul 03 | $120 | Quick bounce back |
| Stable Phase | Jul 03-19 | $120 (constant) | Price lock |
Never Miss a Deal Again
With Bubeph, you can set your desired price point and let us do the work.
Tell Bubeph the price you want, and we'll monitor the product 24/7. The moment it hits your target, you'll receive an instant notification by email, browser, or in the app.
No more checking Amazon over and over
This is an example of an in-app notification you'll receive when a price drops. Depending on your notification settings, you can also receive the same alert by email.
How Our Price Comparison Tool Works
You know that thing where you're checking Amazon, then Best Buy, then target.com trying to find who has the best price? Bubeph does that for you.
You add what you want to track, and it shows you the prices across all your favorite stores in one place. Real-time, no manual refreshing. It watches the prices automatically and hits you up when something actually drops to a good price. So you're not just guessing anymore—you actually know when to hit buy instead of overpaying or waiting forever.
Everything You Need to Track Deals and Save Money
I used to waste hours checking price drops across different websites until I found Bubeph. It pulls all the deal tracking, alerts, and price history into one place—so you're not constantly tab-hopping.
Set up a wishlist, track electronics, or catch deals on everyday stuff. The tool shows you the data that actually matters, so you can buy smart instead of just guessing when prices are actually good.
Bubeph vs Others: Why It's the Best Price Monitoring Tool
Bubeph combines everything you need for smarter online shopping.
- Real-time price tracking
- Interactive price history charts
- Automatic price drop alerts
- Instant price notifications
- Wishlist tracking
- Powerful deal finder
- Advanced price trend analysis
- Clean dashboard for managing all tracked products
Never Miss a Deal Again
Stop overpaying for the products you want. Bubeph monitors Amazon and beyond, tracking price drops in real-time and alerting you when items hit your target price. Get access to complete price history data and make purchases when prices actually work in your favor—not when retailers decide it's time to sell.
Start Saving Today—It's Free